
← Two free tracks · Prop-risk foundations
Free · Order Flow · 1 · written draft for review
Read price before delta
Prerequisite: Structure lesson recommended; no software needed.
Original English written learning is available here. Real clean ATAS captures/continuous replays and independent review are not complete. Hypothetical examples are not trading records.
Foundation lesson — What the candle shows, and what delta cannot prove
Original TrueCostProp draft · English · 25–35 minutes including practice
Education only, not financial advice. Every market number below is HYPOTHETICAL. The diagram is an original teaching schematic, not a screenshot, replay or actual trading record. Futures trading involves substantial risk; no result or evaluation pass is promised. No purchase or subscription is needed for this lesson.
Before you begin
You need only addition/subtraction and the meaning of a buy and a sell. You do not need footprint software, an options feed or a challenge account. This unit precedes advanced absorption, imbalance and entry-model lessons.
By the end, you should be able to (1) reconstruct a candle's open/high/low/close, (2) calculate bid/ask delta, (3) distinguish a price observation from an inventory hypothesis, and (4) explain why neither a wick nor positive delta is a complete trade instruction.
1. Start with the auction, not the colour
A quoted bid is a price at which buyers currently offer to buy; the ask is where sellers currently offer to sell. A marketable order takes available liquidity. A limit order can rest, but a marketable limit order can also take liquidity: “limit” does not automatically mean passive.
When an incoming buy trades against the ask, a typical bid/ask feed classifies that execution as buyer-initiated. A sell trading at the bid is typically seller-initiated. Every execution still has both a buyer and a seller. Positive delta does not mean that more contracts were bought than sold; it means more classified volume was buyer-initiated than seller-initiated over the chosen interval. Classification can be affected by feed quality and platform methodology.
2. A candle is four prices, not a complete story
For one defined interval, open is its first traded price, high its highest, low its lowest, and close its final price. The body spans open to close; wicks reach the extremes. A candle does not tell you the full order in which all intermediate prices traded. Two different paths can produce identical OHLC values.
A rising candle can contain aggressive selling; a falling candle can contain aggressive buying. Candle direction and delta measure different things. Never change chart interval after seeing the result just to manufacture agreement between them.
3. Worked hypothetical chart — pause before the answer
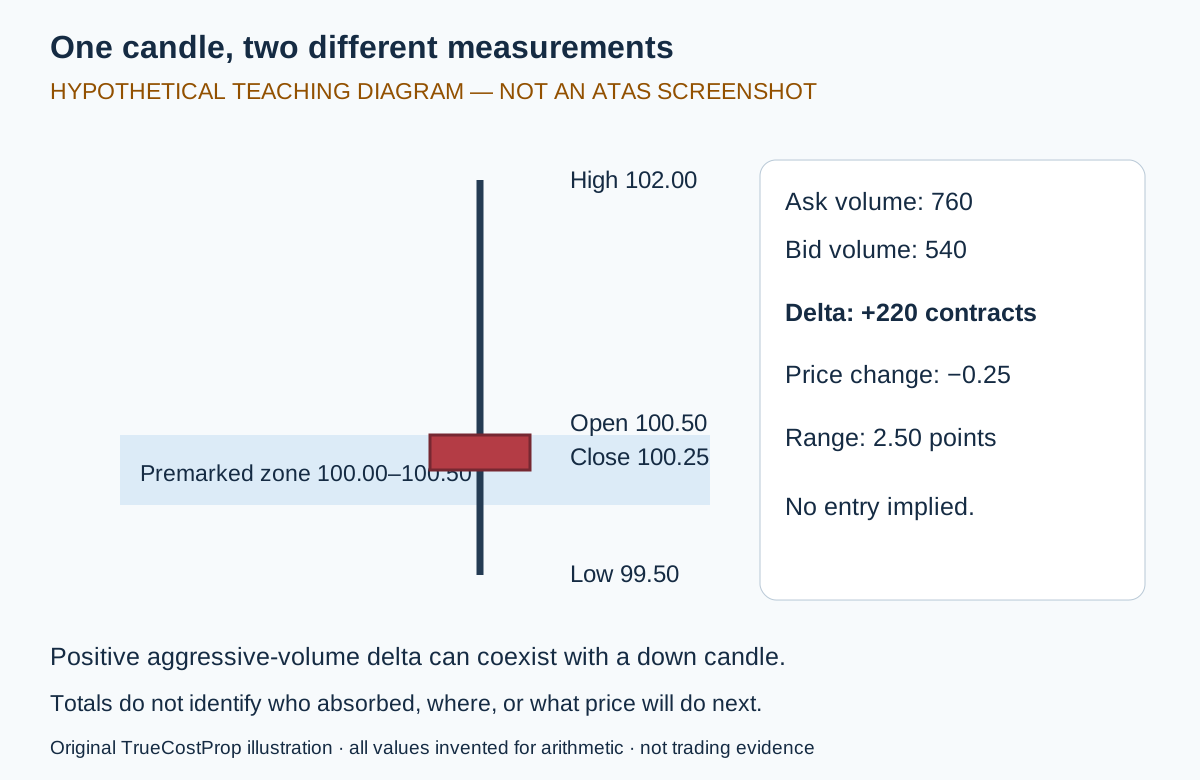
Open the original the labelled diagram below. It is a simple vector diagram that remains sharp when enlarged. Its labels describe a single invented five-minute bar; it is NOT a live ATAS image.
Before the bar begins, the exercise marks a reference zone at 100.00–100.50. This zone is an attention area chosen for teaching, not a proven support level. The bar later has: - Open 100.50, high 102.00, low 99.50, close 100.25. - Classified ask volume 760 contracts and bid volume 540 contracts; all exercise volume is assigned to these two classes.
First, calculate independently: body direction, high-low range, net open-close change, total volume and delta.
Walkthrough: close 100.25 is below open 100.50, so the bar's body is down. Range = 102.00 −99.50 = 2.50 points. Net change = 100.25 −100.50 = −0.25 points. Total = 760 +540 = 1,300 contracts. Delta = ask −bid = 760 −540 = +220 contracts. Positive delta and a down candle coexist without contradiction.
What can you state? More classified volume initiated at the ask than the bid in this interval, while price finished slightly below its start. The low pierced the reference zone and the close returned within it. The bar also traded substantially above the zone. These are observations.
What remains only a hypothesis? Buyers may have met passive supply, but these bar totals do not identify where that supply sat or who supplied it. Some buying could have occurred at different prices earlier in the interval. Calling this a confirmed “seller absorption at 102” from the aggregate numbers alone overstates the evidence. Location-specific executions and their sequence would be needed to investigate that explanation.
Is a return inside the zone proof of support? No. The next interval might hold, break, gap or reverse. This single bar does not establish a repeatable edge, safe entry or suitable stop. Its upper wick is not proof of institutional intent. Correct reading is narrower than a colourful story.
4. Counterexample: same delta, different outcome
A second invented bar has the same ask volume 760 and bid volume 540, but opens 100.50 and closes 102.00 with a high of 102.25 and low of 100.25. Delta remains +220, yet net progress is now +1.50 points. The difference is price response, not delta sign. Without matching location, time sequence and market conditions, comparing these bars does not establish a predictive statistic.
This is why “buy when delta is positive” skips the actual reasoning. First describe what price did at a preselected area; then describe the executions; then say what is unknown. A good sentence can end with “insufficient evidence.”
5. From observation to a safe learning decision
For the worked bar, record: “At the premarked zone, the interval probed below and closed inside; net change −0.25 with +220 delta. I cannot identify exact absorption location from totals. I will observe subsequent completed data in simulation rather than invent an entry.”
What would change the interpretation? Sustained trading below the zone would weaken a hold hypothesis; a later move away might support a provisional rejection description. Neither outcome retrospectively makes the first bar a guaranteed signal. Write your observation before revealing later bars. Save the first note rather than editing it into the winning explanation.
Stand aside from any execution if your feed is frozen/incomplete, contract identity is uncertain, scheduled-event rules or current risk constraints are unknown, or a personal/firm loss stop is reached. Restoring valid inputs matters more than finding another indicator. This unit teaches reading, not a new executable strategy.
6. Clean-chart production specification — still pending
A future real demonstration must use a new clean ATAS chart, not the cluttered existing workspace. One context candle view plus only the executed bid/ask or delta display needed for this explanation; no GEX, heatmap, oscillator or decorative panels. Show contract/month, market date, interval, timezone and replay status. Export a native-resolution PNG with readable price/time labels and unoccluded bars. Do not stretch, upscale, blur or crop away essential provenance. If labels cannot be read at intended viewing size, recapture with larger platform fonts/appropriate zoom rather than enlarging a blurry image.
Retain an uninterrupted real replay around the chosen bar and inspect it before writing claims about sequence. A still alone cannot prove causal order. This lesson currently contains no real ATAS proof or real replay; the SVG illustrates arithmetic only. Do not place it inside a fake platform frame.
Practice — Price response versus delta
English · original draft · all numbers hypothetical. Do not use a trading account.
Unseen case (20 points)
Before an invented bar starts, an observer marks zone 210.00–210.50. The bar opens 210.25, trades as high as 212.00 and as low as 209.75, then closes 210.00. Ask-classified volume is 430 contracts; bid-classified volume is 670. These cover all exercise volume.
- Calculate high-low range, net open-close change and body direction. (4)
- Calculate total volume and delta; state your sign convention. (4)
- Write two observations about the bar relative to the premarked zone, with no attribution of trader intent. (4)
- A friend says “negative delta proves that institutions sold the top at 212; short the next open.” Identify two unsupported leaps. What evidence is missing? (4)
- The next bar has not been revealed. Write a learning decision with one information limitation and one condition that requires standing aside from execution. (4)
Transfer check (not scored, required)
Can a marketable limit order take liquidity? ______ Does a green candle prove positive delta? ______ Does the same OHLC identify every intrabar price in order? ______ Can a hypothetical diagram be presented as real ATAS evidence? ______
Teach-back
Explain in three sentences why every transaction has a buyer and seller but delta can still be negative. Then explain why that delta does not identify the dealer/institution holding the other side. Avoid “smart money”, guaranteed signals and retrospective justifications.
Self-score: ___/20. Correction needed: ______. First attempt saved: ______.
Reveal full reasoned answer key and readiness criteria
Reasoned answer key and readiness gate
Mark the first attempt before correcting it. Subsequent profitability never changes a mark.
- 4 points: Range = 212.00 −209.75 = 2.25 points (2). Net change = 210.00 −210.25 = −0.25 points (1); down body (1).
- 4 points: Total = 430 +670 = 1,100 (1). Delta convention ask minus bid (1); 430 −670 = −240 contracts (2). This classifies aggressive volume, not an imbalance between the total buyers and sellers in executed contracts.
- 4 points: Any two correct narrow statements, 2 each. Examples: low 209.75 is below the zone's lower edge 210.00; close equals the lower edge, not above the whole zone; high is above the zone; open is inside the zone. Do not award points for “institutions defended support” or “price must bounce”. A boundary close is not a full reclaim above 210.50.
- 4 points: Aggregate delta does not locate the selling specifically at 212 or identify institutions (2). It does not authorise a short at the next open or prove a predictive edge (1). Need time/price-specific execution sequence and independently defined setup/risk conditions to investigate, not a new story inferred from totals (1).
- 4 points: Example: “I will keep observing in simulation; the bar closed at the zone's lower edge with −240 delta, but the location and identity of passive participants are unknown. I cannot choose an entry from that alone. If the feed is incomplete, event/risk constraints are unknown or a loss stop is hit, I will not execute.” Award 1 for simulation/no invented trade, 1 for specific missing information, 2 for an explicit valid stand-aside condition. Equivalent reasoned answers allowed.
Transfer answers
- Yes: a limit priced to cross available quotes can immediately execute and take liquidity.
- No: candle direction measures price change; delta measures classified aggressive-volume difference.
- No: OHLC does not reveal every intervening price sequence.
- No: hypothetical art must remain clearly labelled, never represented as actual platform evidence.
Readiness criteria
Written-concept readiness: at least 16/20, all four transfer answers correct, and an accurate teach-back. Treat any claimed guaranteed trade from delta, any invented institutional identity or any hypothetical-as-real evidence claim as a mandatory correction regardless of total. Retest with a new arithmetic variant after rereading, not merely memorising the key.
Teach-back passes when it says: executions always pair buyers and sellers; classification concerns which side takes liquidity; negative delta indicates greater bid-classified aggressive volume under the stated method; that classification does not reveal net inventory/intent or prove a future move. Wording need not match this key.
Real-chart demonstration readiness is PENDING, separate from written readiness. It requires a fresh clean native-resolution ATAS capture, unambiguous instrument/date/interval/timezone provenance, legible labels at delivery size, only essential indicators, and an uninterrupted inspected replay for any sequence claim. No such capture/replay is supplied here. Independent technical and pedagogical review also remain pending. This draft is not commercially approved or validated trading advice.
Education only. Futures involve substantial loss risk. No profit, pass rate or institutional intent is established by these examples. No signup, evaluation purchase or paid feed is required.
Next in the recommended reading order: Volume profile and VWAP: build context